PowerCharts Plug is a set of advanced charting widgets that allow you to plot visually arresting, interactive and powerful charts. Intensively using the rich feature set provided by Adobe Flash (formerly Macromedia Flash), the charts from PowerCharts Plug allow you to add Rich Internet Applications (RIA) functionality to your web apps, thereby rendering an end-user experience like never before.
These charts can be used for a variety of purposes like simulations, visual data selection, scientific plotting, financial analysis etc.
PowerCharts plug is NOT a standard part of FusionCharts v3 Suite and needs to be purchased separately.
You need to have Adobe Flash Player 8 (or above) to view the charts below. If you do not have the same, you can install it here for free.
PowerCharts offers a variety of charts as shown below.
Drag-node Chart
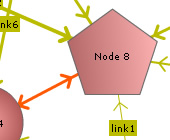 The drag node chart is a specialized chart where each data set is shown as a drag-able node. Perfect for network diagrams, hierarchy structures etc., this chart provides a highly intuitive interface to visually adjust related entities, link them and even add new ones. You can take visual inputs from your users using this chart and then submit it to your scripts for further processing.
Multi-axis Line Chart
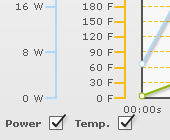 The Multi-axis line chart is an interactive line chart that allows you to plot multiple axes on the same chart. Multiple lines can be plotted against a visible or an imaginary axis. You can opt to show/hide data for any particular axis using the checkboxes present for each axis. Dynamic shifting of axes are also allowed at client side, by just clicking on a non-primary axis.
Select Scatter Chart
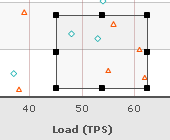 The Select Scatter chart is a special type of chart that allows you to visually select a subset of data from the given data points. Essentially, it's an extension of XY Plot Chart from FusionCharts v3 with the added functionality of selecting any number of points on the chart and returning them back to server (or JavaScript functions).
Drag-able Column, Line & Area Charts
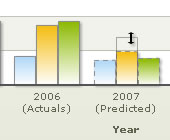 The drag-able charts are a special set of charts that allow you to visually manipulate the data on the chart and then submit it back to server. These charts can be used for simulations, financial planning etc. Currently, there are 3 drag-able charts available - Drag-able Column 2D Chart, Drag-able Line 2D Chart & Drag-able Area 2D Chart.
Interactive Candlestick Chart
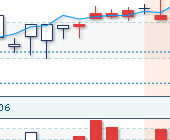 The Candlestick chart from FusionCharts v3 PowerCharts suite offers your a powerful and interactive interface to plot your stock data. In this chart, you can have integrated price and volume plot. Volume plot can be turned on or off at will. Also, there are multiple options for price plotting - Candlestick / bar / line. Interactive tool-tips and custom divider lines are possible.
Waterfall Chart
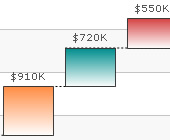 A waterfall (cascade) chart is a special type of column chart. A typical waterfall chart shows how an initial value is increased and decreased by a series of intermediate values, leading to a final value. FusionCharts Waterfall chart allows you to configure a lot of visual and functional options. This chart offers all the interactive options of FusionCharts framework.
Multi-level Pie Chart
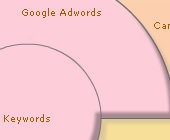 The multi-level pie chart is a special type of chart that allows you to show symmetrical and asymmetrical tree structures in a consolidated pie like structure. The advantage of using this chart over a tree view is that you can give a single screen snapshot of the entire data to be presented. Possible uses are visualization of analytics data, organization trees etc.
Logarithmic Charts
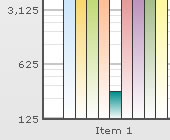 PowerCharts introduces logarithmic charts in the suite. You can select any positive base (apart from 1) for your logarithmic scale. The logarithmic y-scale can also be inverted to show charts like ranking charts etc. You can select your own y-axis Lower and uper limits, apart from the number of minor divisional lines between any two major divisional lines.
Spline Charts
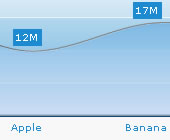 PowerCharts introduces spline charts in the suite. Currently, there are 4 spline charts in the suite:
- Single series Spline
- Single series Spline Area
- Multi-series Spline
- Multi-series Spline Area
Inverse y-Axis Charts
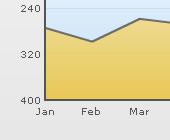 The inverse y-axis charts are similar to the normal FusionCharts v3 charts but for the fact that y-axis in these charts are inversed. In the inverse y-axis charts, the chart lower limit is shown at top and the upper limit is shown at bottom of chart canvas. This makes the chart very effective to plot information like ranking, hits trend etc.
Radar Charts
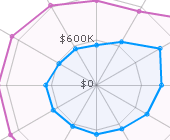 Radar Chart allows you to intuitively and graphically display different Key Performance Indicators (KPIs). You can see how different plants and system compare in real time, as well as fixed targets, at a glance. Radar charts are useful when you want to look at several different factors all related to one item. Radar charts have multiple axes along which data can be plotted.
Error Bar Chart
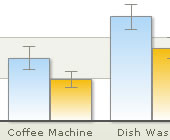 Error bar charts are used to show statistical information about the data displayed on the chart. This chart uses an additional y value to show the error value on the chart. These values can be assigned to each point in an Error Bar chart. In most cases, these values are calculated from the data present in another series. You can opt to show full error bars or half error bars.
 A type of chart developed by the Japanese in the 1870s that uses a series of vertical lines to illustrate general levels of supply and demand for certain assets. Thick lines are drawn when the price of the underlying asset breaks above the previous high price and is interpreted as an increase in demand for the asset. Thin lines are used to represent increased supply when the price falls below the previous low.




 The drag node chart is a specialized chart where each data set is shown as a drag-able node. Perfect for network diagrams, hierarchy structures etc., this chart provides a highly intuitive interface to visually adjust related entities, link them and even add new ones. You can take visual inputs from your users using this chart and then submit it to your scripts for further processing.
 The Multi-axis line chart is an interactive line chart that allows you to plot multiple axes on the same chart. Multiple lines can be plotted against a visible or an imaginary axis. You can opt to show/hide data for any particular axis using the checkboxes present for each axis. Dynamic shifting of axes are also allowed at client side, by just clicking on a non-primary axis.
 The Select Scatter chart is a special type of chart that allows you to visually select a subset of data from the given data points. Essentially, it's an extension of XY Plot Chart from FusionCharts v3 with the added functionality of selecting any number of points on the chart and returning them back to server (or JavaScript functions).
 The drag-able charts are a special set of charts that allow you to visually manipulate the data on the chart and then submit it back to server. These charts can be used for simulations, financial planning etc. Currently, there are 3 drag-able charts available - Drag-able Column 2D Chart, Drag-able Line 2D Chart & Drag-able Area 2D Chart.
 The Candlestick chart from FusionCharts v3 PowerCharts suite offers your a powerful and interactive interface to plot your stock data. In this chart, you can have integrated price and volume plot. Volume plot can be turned on or off at will. Also, there are multiple options for price plotting - Candlestick / bar / line. Interactive tool-tips and custom divider lines are possible.
 A waterfall (cascade) chart is a special type of column chart. A typical waterfall chart shows how an initial value is increased and decreased by a series of intermediate values, leading to a final value. FusionCharts Waterfall chart allows you to configure a lot of visual and functional options. This chart offers all the interactive options of FusionCharts framework.
 The multi-level pie chart is a special type of chart that allows you to show symmetrical and asymmetrical tree structures in a consolidated pie like structure. The advantage of using this chart over a tree view is that you can give a single screen snapshot of the entire data to be presented. Possible uses are visualization of analytics data, organization trees etc.
 PowerCharts introduces logarithmic charts in the suite. You can select any positive base (apart from 1) for your logarithmic scale. The logarithmic y-scale can also be inverted to show charts like ranking charts etc. You can select your own y-axis Lower and uper limits, apart from the number of minor divisional lines between any two major divisional lines.
 PowerCharts introduces spline charts in the suite. Currently, there are 4 spline charts in the suite:
  The inverse y-axis charts are similar to the normal FusionCharts v3 charts but for the fact that y-axis in these charts are inversed. In the inverse y-axis charts, the chart lower limit is shown at top and the upper limit is shown at bottom of chart canvas. This makes the chart very effective to plot information like ranking, hits trend etc.
 Radar Chart allows you to intuitively and graphically display different Key Performance Indicators (KPIs). You can see how different plants and system compare in real time, as well as fixed targets, at a glance. Radar charts are useful when you want to look at several different factors all related to one item. Radar charts have multiple axes along which data can be plotted.
 Error bar charts are used to show statistical information about the data displayed on the chart. This chart uses an additional y value to show the error value on the chart. These values can be assigned to each point in an Error Bar chart. In most cases, these values are calculated from the data present in another series. You can opt to show full error bars or half error bars.
 A type of chart developed by the Japanese in the 1870s that uses a series of vertical lines to illustrate general levels of supply and demand for certain assets. Thick lines are drawn when the price of the underlying asset breaks above the previous high price and is interpreted as an increase in demand for the asset. Thin lines are used to represent increased supply when the price falls below the previous low.